
Many people are unduly intimidated by the thought of teaching probability. At its most basic level, probability revolves around being able to predict whether a future event is certain, possible, or impossible. The world of “possible” events can then be explored more subtly in terms of how likely or unlikely they are. These basic concepts grow and develop into a more mathematical understanding of likelihood as children learn to quantify that understanding. Probability concepts can be challenging for children because they are often encountered in a way that requires a functional application of number—the ability to use and compare numbers for meaning rather than just being able to read them. Thinking about probability can also mean framing the likelihood of an event in terms of imagining multiple iterations of the same action with different potential outcomes, which is very different than just knowing that one outcome is more likely than another. Just think about the sophistication necessary to process the day’s weather report, such as “There is an 80% chance of rain today.”
By age 4 or 5, most children can apply concepts of likelihood to some practical questions of future events in their lives. Some things are more likely than others, and children know it: for example, the possibility of having ice cream for dinner is very, very low at most houses, even if the chance of it happening is slightly nonzero. However, games are a place where children encounter probabilistic events in ways that generate extremely complex outcomes, and it may be harder to predict whether something is truly a pattern or just a false pattern, or likely or unlikely (e.g., “I’ve landed on Boardwalk the last three times around the board, so I’ll probably land on it this time as well.”). Instead of focusing on how player choice is driven by the random element of a dice roll—as in Monopoly—it is possible to design games that draw careful attention to the patterns of probability built into the game itself and to make both the pattern and the random source materials accessible to the children. This design element can be skewed to quantifiably model different levels of likelihood in a way that is visible, concrete, and engaging for young children.
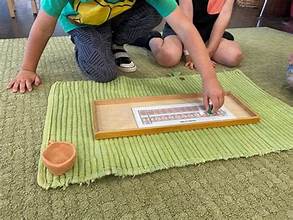
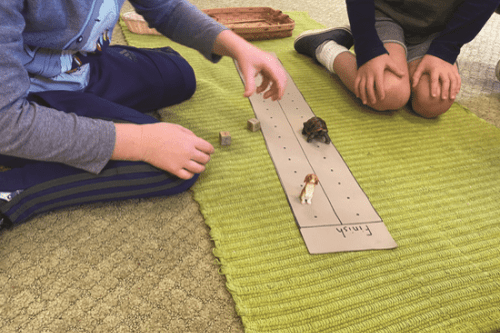
A good beginning work to start children thinking about the likelihood of a random game event is a simple Heads or Tails coin-flipping race. This is a statistically neutral game, where the coin outcome is truly unbiased (that is, flipping heads or tails is equally likely). This can be played as a one-player game, but usually two children set up the game with a small counter, such as a pebble, on the heads and tails starting spaces (see Figure 1). During game play, the children take turns flipping a penny and moving either the “heads” or “tails” counter from left to right until one of them crosses the finish line. It is useful for children to play this game over and over, to keep track of whether heads or tails wins more games and to try and predict the next winner. After playing this game a few times, a child may still say something to the effect of: “Heads won the last two games, so heads is better today.” The complex behavior of even a simple system like this easily takes on a sense of agency to young children. However, after playing it many times and keeping score, some children will be able to make observations like: “Heads and tails win about the same number of races,” or “I don’t know which one will win next time.”
FIG. 1.
One possible design for a Heads or Tails game board. This design is clear and simple for children to manage. By setting up the board with 10 spaces to move, the game can later be revisited when studying percentages as well.
Double Heads Or Tales
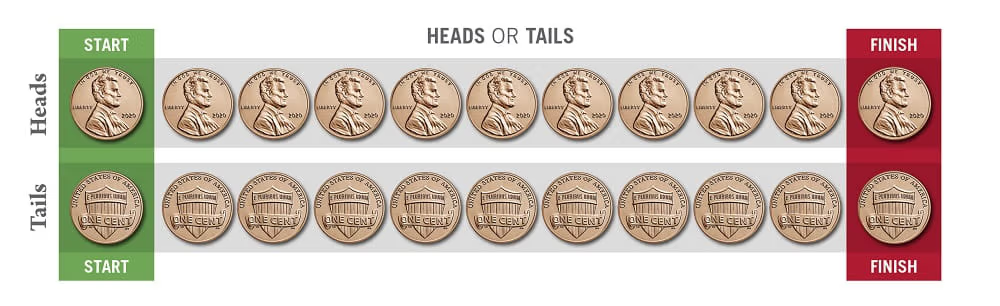
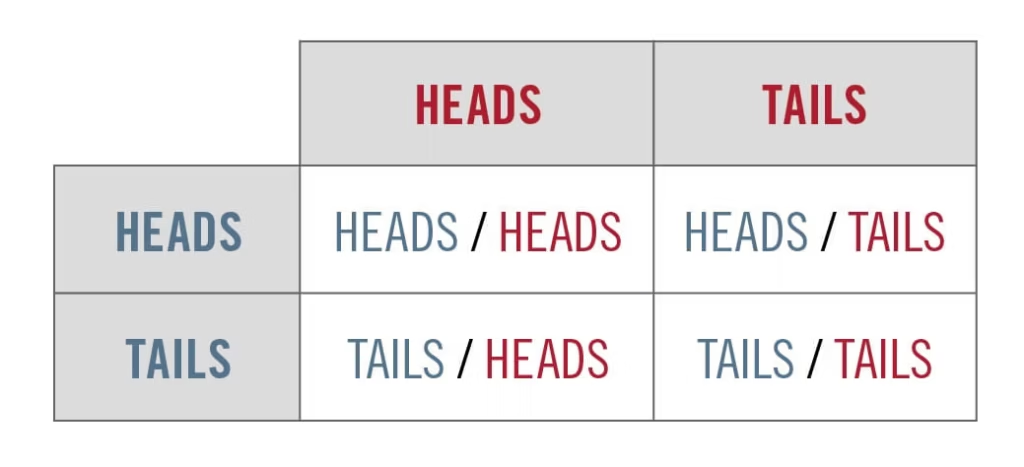
After children have played the one-coin version of Heads or Tails, a second version of the game can be introduced with two pennies. For each turn in this game, the child flips two pennies, moving the counter for one of the three possible outcomes: heads/heads, heads/tails, or tails/tails (see Figure 2). Since the heads/tails combination is twice as likely as either of the others, it virtually always finishes first. This is a biased game whose outcome is usually the same, and even in a Montessori environment full of “finishing games,” it forces rethinking about the nature of game play. Children are fascinated by the fact that the heads/tails combination always seems to win and play the game over and over just to see it happen again.
In its final positions, this game has a very strong central tendency, meaning that most results tend to fall toward the middle of the range, and results further from the middle are less and less frequent. Central tendency is one quality of the “normal distribution,” or bell curve shape, ubiquitous in describing populations or groups of related events. This game almost always ends with the counters in the same configuration: heads/tails reaching the end when heads/heads and tails/tails are only about halfway down the board. As an intentionally biased game, it proposes a mystery to the children: Why does the heads/tails combination always win? How is this different from the previous penny-flipping game? Giving children a clue here by providing two very distinct-looking pennies—for example, painting one blue and one red—can help them notice that there are two ways to make heads/tails. For most young children, the pattern in this work remains a kind of number magic unless one makes the pattern very explicit, such as graphing it out with them, as in Figure 3.
FIG. 2.
One possible design for the Double Heads or Tails game.
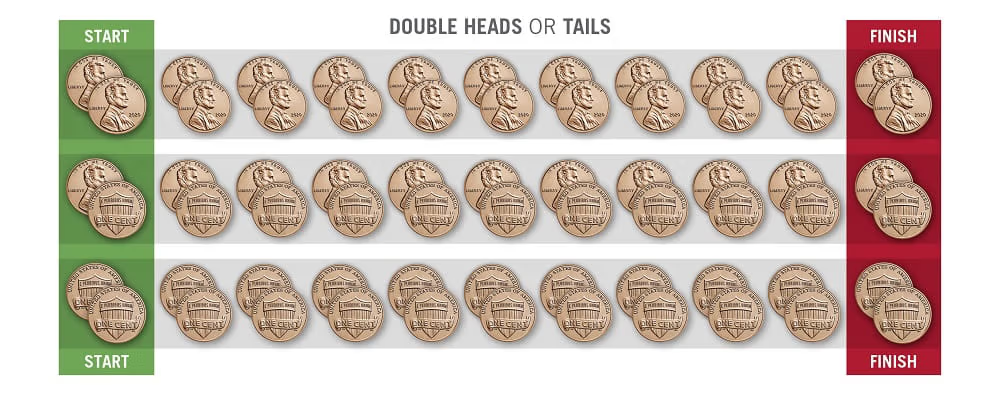
FIG. 3.
Present the work again with two painted pennies, one painted red (or with a dot of red on both sides) and one painted blue (or with a dot of blue on both sides). “There are a blue penny and a red penny. What are all the possible ways that they could be flipped?” “How many combinations make Heads/Heads, Heads/Tails, and Tails/Tails?”
Dice Graphing
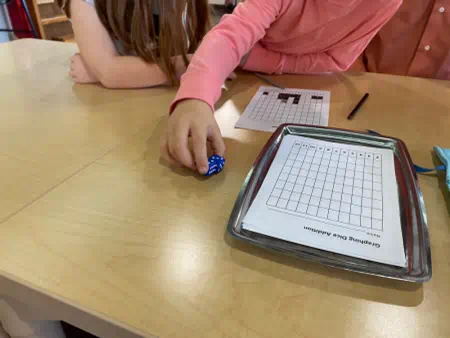
Similar to coin flips, dice rolls can also function as random events. For very young children first acquiring an understanding of numbers 1–10, rolling a single die and then using the outcome to fill in a graph is a good activity to reinforce numeral quantity association. With each roll, the child colors in one box in the column corresponding to the number on the die (see Figure 4). Like the first Heads or Tails race, this activity is statistically neutral, and any number is equally likely to finish first.
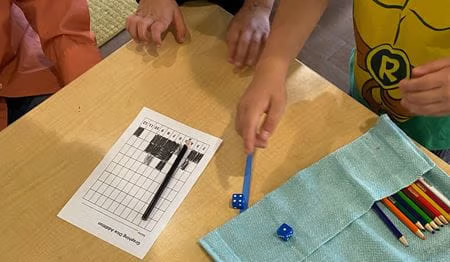
A more complex articulation of central tendency can be created by rolling two dice, adding them, and graphing the outcomes in a similar way (see Figure 5). In this version, each column on the graph is labeled with the numerals 2–12, and the activity continues until any one column is full again. The central tendency of this activity is not nearly as strong as in Double Heads or Tails, so the pattern can be a little more noisy, but it almost always produces a good central peak. As with Double Heads or Tails, there are more combinations of dice faces that produce the outcomes nearer to the middle, but this is also not a true normal distribution.
After playing the two-dice addition/graphing game several times, it is interesting to ask children some questions about it. The numbers 6, 7, and 8 are the most likely to “win,” but the likelihood is not strong enough that it is certain. Children are usually hesitant to make predictions about which number will win but can very quickly articulate that the numbers at the extremes are highly unlikely to do so. One child in my classroom who chose this work every day for weeks finally started counting how many rolls it took to roll a 2 and was consistently amazed at how infrequent it was: “I had to roll the dice 42 times before I rolled a 2.”
After a child has chosen this work many times, it can be interesting to sit down together and write out all of the possible outcomes of rolling two dice as addition problems (e.g., “How many ways can we roll 2 with two dice?” “A 1 and a 1 is the only way.”) For some children, seeing that the pattern is literally built into the mechanics of the game is kind of like reveal-ing a magic trick. The game itself is a system with an innate bias.
FIG. 4.
Dice graphing with a single die completed by students. Children quickly realize that they cannot predict which number will finish first next time.
FIG. 5.
Dice addition graphs completed by students.
For children at the kindergarten level, these works create a sensorial impression of central tendency. We see groupings with a cluster of data points around the middle and progressively fewer points as we move toward the extremes. Graphing out any number of other data sets, such as the height of the children, will produce eerily similar patterns. The power of mathematics lies in its ability to compare patterns in this way, even if we cannot meaningfully quantify the similarities of these curves with 6-year-olds beyond comparing their visible shapes.
The Fractional Spinner
By age 6, many Montessori children are beginning to encounter the concept of fractions both in their daily lives, when things are divided up or split, and in their classrooms, with Montessori materials. The Fraction Insets material divides a circle into progressively smaller wedges as a way to represent the division of a whole into fractional units. By placing a red Fraction Inset wedge on a round white spinner, you can introduce likelihood in a visibly quantifiable way. Children developing an understanding of fractions with the Insets can often describe how much of each color is visible (e.g., “1/10 is red. There are 10/10 in the whole circle, so 9/10 are white.”). Beyond just naming the number, the fraction can then be presented as a ratio, comparing the proportions of different colors in terms of likelihood (e.g., “1/10 of the spinner is red. That means we would expect 1 out of every 10 spins to land in the red part.”). Any of the fractional wedges can be used for this, but 10ths are convenient because you can tie them back to percentages later.
This prediction is a matter of statistical likelihood and is almost always approximate rather than exact. Spinning and recording over and over can then gradually home in on this ratio in actual data. Six-year-olds cannot typically perform an activity like this many times and then look at a large data set, such as 4 reds and 36 whites, and see it as an expression of a 1 in 10 likelihood, so the best way to record spins visually and organize the results is to keep them in groups of 10 and then compare several sets for similarities.
By age 6, many Montessori children are beginning to encounter the concept of fractions both in their daily lives, when things are divided up or split, and in their classrooms, with Montessori materials.
There are many ways to record activities, such as the fractional spinner, that deal with ratios, but one of the clearest and most tactile is to use marbles in two colors. Red and white marbles correspond nicely with the colors of the fractional spinner and offer high contrast. In my classroom, I keep a basket of 200 marbles on the shelf—100 white marbles and 100 red marbles. Children can keep track of the spinner’s outcomes by taking one of the appropriately colored marbles from the basket for each spin.
Red And White Marbles For Percentage Work
The concept of percentage can also be explored using 100 red and 100 white marbles and a mystery bag. Start by having the children count out the marbles to confirm how many there are. Counting sets of 10 is the easiest way to do this. Say, “Percent means ‘out of 100.’ A 100% chance means something is certain to happen, and a 0% chance means it is impossible for something to happen. I’m going to put only the 100 white marbles into the bag. How likely will you be to pull out a white marble? How likely will you be to draw out a red marble?” Drawing out a red marble is clearly impossible here, and children see this as a ridiculous question. Many children may be able to respond 100% and 0% to these questions. If there are several children at this lesson, let them each draw 1–2 marbles to verify.
Next, say, “We are going to replace 10 of the white marbles with 10 of the red marbles.” Pull out 10 whites and put in 10 reds. “How many marbles are in the bag now? How many white ones are left? How likely am I to draw out a white marble?” Some children with a solid understanding of number from 1 to 100 will be able to answer all of these questions correctly. As before, have children pull 1–2 marbles each and then hold them all out to count. As with the fractional spinner, the result will likely not be exactly one red marble and nine white marbles. “We had a 90% chance of drawing out a white marble from this bag, but that was only a prediction. The more marbles we draw, the closer we will get. We might have to draw out all 100 marbles before we got every white one.” Keep replacing the white marbles in sets of 10 until there are 50 of each, and each color is equally likely.
Quantifying likelihood with these tools can also be explored from the other direction. Place 10 marbles in the bag, but do so in dramatic secrecy so that the color of the marbles—red or white—is a mystery to the children. The goal is to guess what is in the bag. Take turns pulling one marble, recording its color, and then putting it back. In this version, it is very important to put each marble back before drawing the next one out, so that the ratio of colors available for each draw remains the same. Children are very eager to make predictions in this game, even after just drawing 1–2 marbles when the sample size is very low.
As a logic game, it is interesting to ask the children during the game, “What do we know about the contents of the bag?” After drawing red 5 times, a child might initially say, “There are 5 reds,” but logically all we really know is that there is at least 1 red. We might have drawn the same red marble 5 times. As more marbles are drawn, the recorded color distribution should represent the contents of the bag better and better, and the children can begin to guess whether there are more whites or reds. From limited certainty, the conversation can then shift to predictions based on the ratio: “How many red marbles do you think are in the bag?” By drawing 10 marbles before guessing, we can also compare the 10 draws directly to the 10 actual marbles and see how similar they are.
The “Tortoise And The Hare” And The Statistically Biased Dice
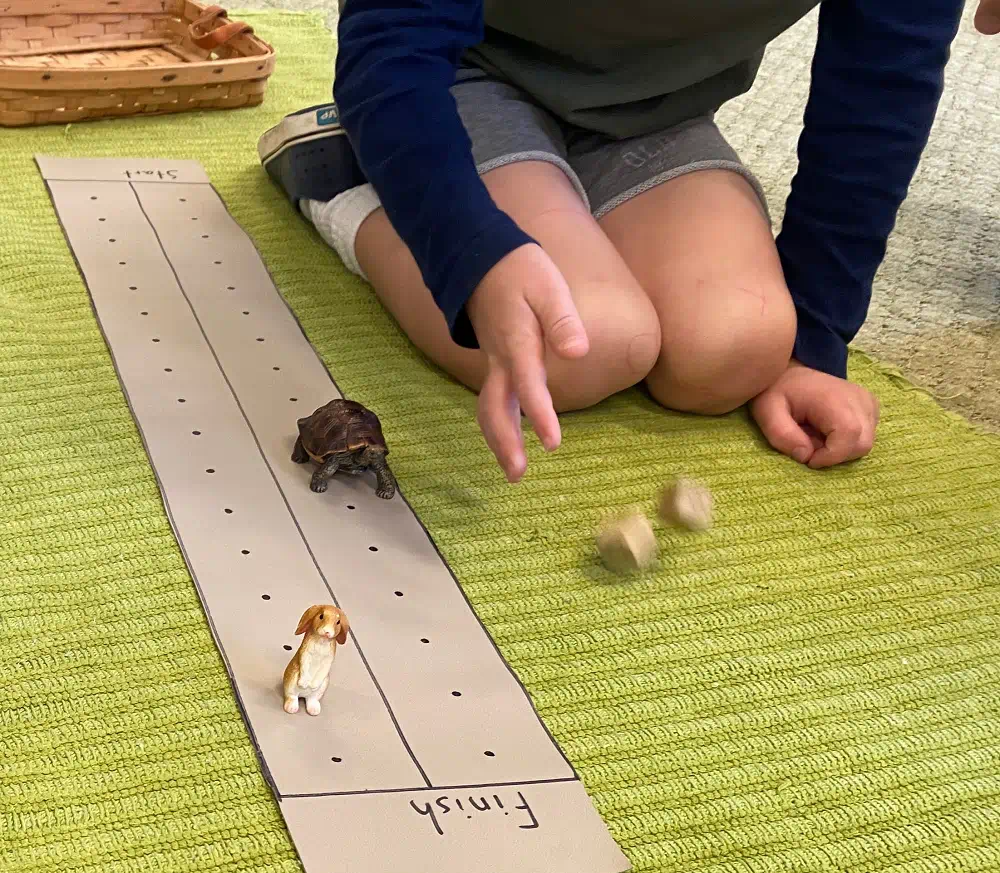
As a final offering about probability and prediction, the Tortoise and the Hare game is a favorite in my classroom. This game is a statistical expression of the classic moral fable, which offers a great message about the importance of effort and grit over mere innate skill without a willingness to work hard. The fable is built into a probabilistic game using two 6-sided dice, each with very different number sets. These dice give the Tortoise a statistical advantage despite the fact that the Hare is capable of moving a much greater distance when he actually moves. I made custom dice for this game by drawing numbers on blank wooden cubes. The sides of the Tortoise’s die say 2/2/2/1/1/1, and the sides of the Hare’s die say 8/0/0/0/0/0. There are 17 spaces on the race track, so the Hare has to hit 8 three times in order to complete the track.
The lesson on the game begins with a retelling of the fable using the game pieces, clearly showing the children how the dice create a mathematical representation of the story:
The Hare was the fastest animal, and he loved challenging other animals to races because he liked to win and brag about it. He could run faster than Ben and Adalynn and Charlie (name all the children listening; they love this). One day, the Tortoise challenged him to a race. The Tortoise was the slowest animal. The Hare thought this was funny, and since he knew he was so fast, he didn’t think he needed to work very hard to beat the Tortoise.
It is a great service to young children to do this kind of engaging work with them and call it by its name: “statistics.”
Show the child the Hare’s die, and say: “The Hare can run 8 spaces in a turn, but most of the time he just sleeps” (lay the Hare on its side whenever it rolls a 0). Show the child the Tortoise’s die, and say: “The Tortoise knew that he wasn’t very fast, but he was willing to work as hard as he could, so he kept going slowly and steadily throughout the race.”
As the race plays out, the two characters move very differently but often end up covering the track at nearly the same pace, periodically tying the race up. The Tortoise’s statistical advantage is fairly small in this version, and the Hare some-times wins, which makes the game more interesting (on average, the Tortoise moves 1.5 spaces per roll, and the Hare only moves 1.3 spaces, so the Hare wins about 1 in every 6 games). Children are fascinated by the differences in their motions but find it challenging to critically evaluate them. Even though the Hare usually loses, children still frequently identify him as the “better racer” when asked, because he is capable of running so much faster when he chooses to. In the original fable, the Tortoise and the Hare never get a rematch, so this game is an invitation to consider the realm of possibility around the story a little differently.
FIG. 6.
The Tortoise and the Hare, with their track and special dice. To make it clear, the numerals are different colors on each die.
Conclusion
These games serve as the beginning of conversations with children about how to describe and measure the likelihood of events and about noticing patterns of outcomes that are built into systems. All of the activities described in this article are appropriate for introduction in a 3–6 classroom and are also appropriate to continue working with and reflecting on in a 6–9 classroom. Children in a 6–9 classroom will be increasingly able to think about these activities logically and approach them with greater abstraction to explain why they exhibit the behaviors they do.
In a world in which the majority of people become math-phobic by adulthood, it is a great service to young children to do this kind of engaging work with them and call it by its name: “statistics.” Statistics is a tool that can be used throughout life to help clarify patterns and relationships that are predictable but not simply linear, from sports to astrophysics. Early Childhood students are learning to understand the world as a predictable place. Using numbers to help understand patterns in this way is a good first step toward appreciating the poetry and power of mathematics and the joy of collecting data to reveal patterns!
Probability Resources
The website A Pinch of Kinder has an excellent post entitled “Teaching Probability in Kindergarten.” It offers good, practical ways to help children develop a model for understanding likelihood—particularly in visualizing and using the language of likelihood—and it inspired me to create the bag of marbles activity (pp. 41–42).
Mensa for Kids has a series of lessons quantifying probability for Elementary-age children that would act as excellent extensions of these concepts in a 6–9 classroom.
For printable versions of the Dice Graphing and Graphing Dice Addition activities, please visit our member resources page.